arthas 火焰图相关命令
arthas 中 profiler 命令支持生成应用热点的火焰图。本质上是通过不断的采样,然后把收集到的采样结果生成火焰图。
启动arthas:
java -jar arthas-boot.jar
开始收集火焰图:
[arthas@1]$ profiler start
Profiling started
[arthas@1]$ profiler status
Profiling is running for 6 seconds
[arthas@1]$ profiler status
Profiling is running for 27 seconds
[arthas@1]$ profiler getSamples
2
[arthas@1]$ profiler getSamples
4
[arthas@1]$ profiler stop --file /tmp/cpu-result-1.html
OK
profiler output file: /tmp/cpu-result-1.html
命令说明:
profiler start开启火焰图收集;profiler status查看火焰图收集的状态,会显示当前已经采集多长时间;profiler getSamples获取已采集的 sample 的数量,理论上,sample 越多,结果越准确;profiler stop --file /tmp/cpu-result-1.html停止当前火焰图收集,会输出到文件中去,生成的文件就是火焰图;
关键参数说明
event
-e, –event
如果想采集内存信息,可以用以下命令:
profiler start --event alloc
file
-f, --file <value> 输出的文件,主要支持 html, jfr 两种格式;
profiler stop --file /tmp/cpu-result-1.html
duration
-d, --duration <value> 指定结束时间;
profiler 执行 30 秒自动结束:
profiler start --duration 30
火焰图分析方法
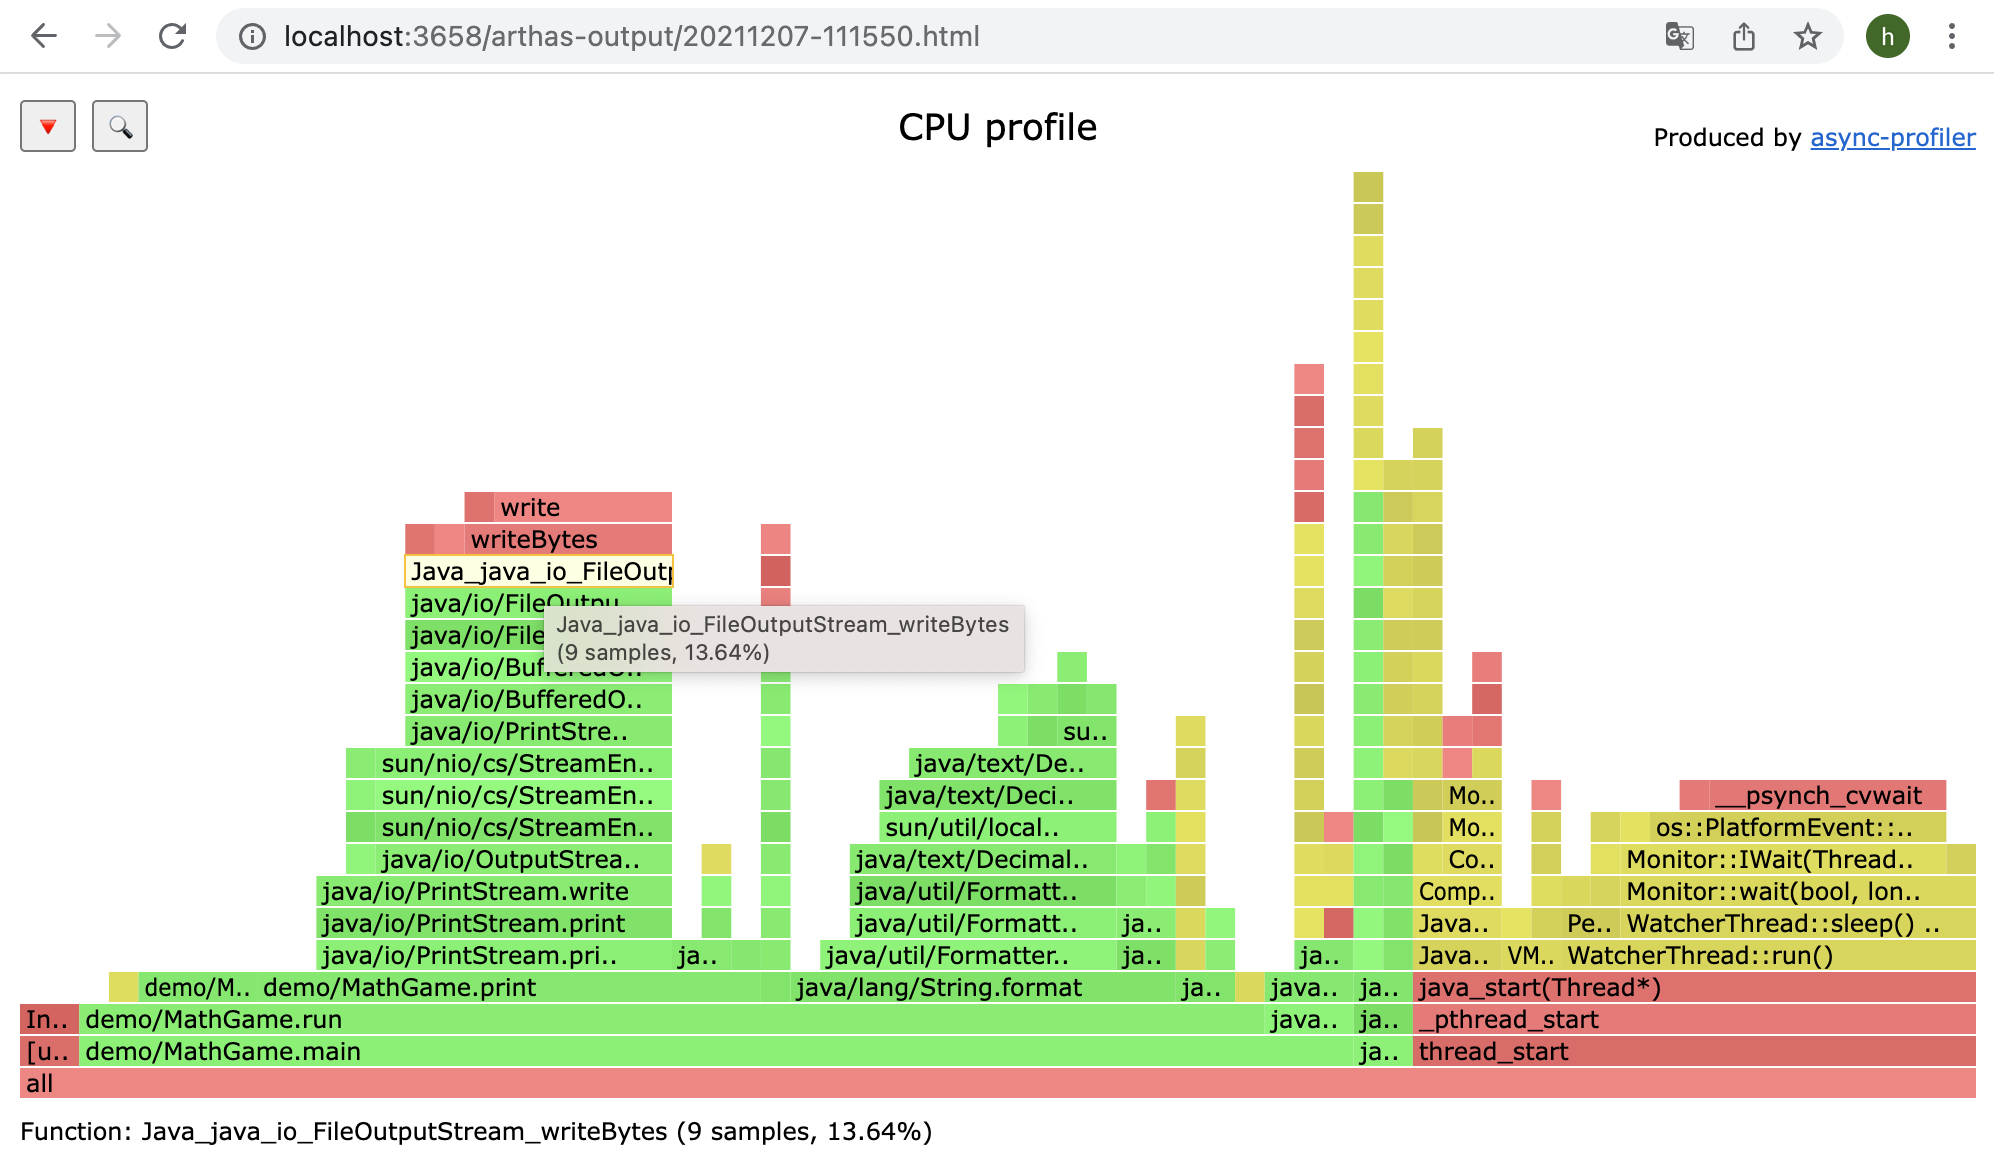
arthas 火焰图颜色说明:
- 绿色: java 代码
- 黄色: jvm c++ 代码
- 红色: 用户态 c 代码
- 橙色: 内核态 c 代码
这里分析java进程,主要看绿色部分;
纵轴表示函数调用栈,每一层是一个函数;
横轴表示抽样数,每一格的宽度越宽,表示它被抽样到的次数越多,侧面反应执行时间越长;火焰图的每一格,鼠标悬浮时会显示完整的函数名、占据总抽样次数的百分比,以此来对比不同函数的耗时差别;
- CPU 火焰图,能找出cpu占用高的问题函数,分析代码热路径;
- 内存火焰图,能找到内存占用高的对象,申请内存多的函数;
参考: